How to Create Graphs for Similar Entity Search
How to Create Graphs for Similar Entity Search
We demonstrate the application of graphs for data analysis and similar entity searches based on the connections.
The interest in graph algorithms has increased tremendously as they are explicitly developed to gain insights from the connected data. Analytics on graphs can uncover the workings of sophisticated systems and networks on a massive scale for any organization.
Everything is driven by connections — from financial to social and biological processes. Explaining the patterns and the meaning behind these connections leads to breakthroughs across industries. “You have a new friend suggestion” on Facebook is a product of lots of algorithms applied on a social connection graph.
What are Graphs?
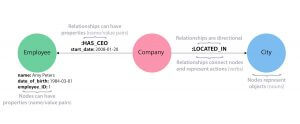
An example Graph
Nodes: They are the elements that represent an entity. Nodes can have various attributes (properties) associated with them.
Relationships: They represent connections between nodes. Relationships can also have attributes associated with them.
Graphs: They are a representation of data in terms of vertices (nodes) and edges (relationships) between them. Edges can be directed or undirected.
SQL vs Graph Database:

Relational Database (Person and Department tables)
In a Relational database, data is stored using tables. Any data related to one entity that can have multiple possible values (one-to-many/many-to-many relation) is stored using bridge tables. In the above case, Alice with id 815 is a part of multiple departments. This is represented using multiple records in a bridge table.
To find which departments Alice belongs to, we have to first search for Alice in a Person table, then look for her ID in a bridge table which will give 3 records. Using the ID’s we have to then get the name of the departments to which Alice belongs.
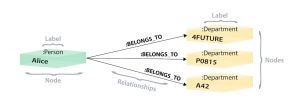
Graph representation of the relational database
In a graph database, we can find the node that represents Alice and then traverse all the BELONGS_TO relations to reaching departments that Alice belongs to (and a lot fewer table joins)
Let’s Create a Graph!?
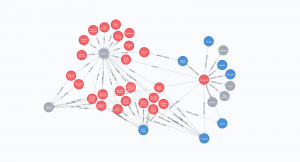
Food graph with multiple relationships.
This is a food graph created from this dataset. It contains information about restaurants in Bangalore city. This database is created using the Neo4j graph database. A slice of data is available here. The code and logic to create the graph are available in this repository.
This graph contains information about restaurants in Bangalore city. It contains 5 types of nodes: Restaurant, Dish, Cuisine, Location, and Type(eg: Cafe, Bar). These nodes have 5 different relations among themselves:
- Fall Under (Restaurant ? Type) eg: Tea Villa Cafe will fall under Cafes
- Serves Cuisine (Restaurant ? Cuisine) eg: Udupi Delux restaurant serves South Indian Cuisine
- Serves Dish (Restaurant ? Dish) eg: Jashn Hyderabadi Bawarchi serves Chicken Biryani
- Famous For (Restaurant ? Dish) eg: Ottimo-ITC Gardenia is famous for Ravioli
- In Area (Restaurant ? Location) eg: Bathinda Junction is in Banashankari
Food Insights
- On average, a Restaurant in Bangalore serves 15 dishes with a few restaurants serving up to 500 dishes.
match (n:Restaurant) return avg(size((n)-[:SERVES_DISH]-(:Dish)))

match (n:Restaurant) return max(size((n)-[:SERVES_DISH]-(:Dish)))
- The most famous cuisine served in Bangalore is of course not South Indian, but it is North Indian. Out of the 8792 restaurants used in this case study, 3863 served North Indian Cuisine, 2860 serve Chinese followed by South Indian Food on no.3 with 1946 restaurants.
match (n:Restaurant)-[x:SERVES_CUISINE]-(j:Cuisine{name:”South Indian”}) return j.name,count(distinct(n)) as c order by c limit 100

match (n:Restaurant)-[x:SERVES_CUISINE]-(j:Cuisine) return j.name,count(distinct(n)) as c order by c DESC limit 100
- “Chicken Fried Rice” is the most served dish while “Eggplant wrap” is one of the least served dishes.
match (n:Restaurant)-[x]-(j:Dish) return j.name,count(x) as c order by c DESC limit 100
Finding Similar Restaurants
A graph is a collection of nodes and relationships. Each connection in a graph represents a relation between two nodes. In terms of a food graph, nodes sharing relationships with the same type of nodes are similar nodes.
eg: Two restaurants that serve the same cuisines are connected to the same cuisine nodes.
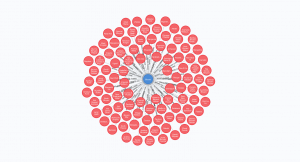
Restaurants that serve Biryani
As more and more types of relationships are added to the graph, the similarity search can be fine-tuned.
The Jaccard Similarity also called the Jaccard Index or Jaccard Similarity Coefficient is a classic measure of similarity between two sets that were introduced by Paul Jaccard in 1901. Given any 2two sets, A and B, the Jaccard Similarity is defined as the size of the intersection of set A and set B (i.e. the number of common elements) divided by the size of the union of set A and set B (i.e. the number of unique elements).
The mathematical representation is written as
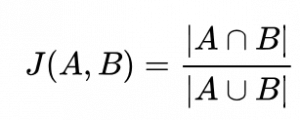
Jaccard Similarity Metric
In our case, the two sets to find similarity are set A and set B. Set A is the list of connections of node A and Set B is the list of connections of node B. The similarity score between nodes A and nodes b is given by J(A, B).
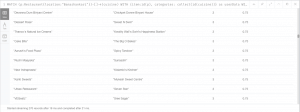
Similar restaurants based on the count of intersections in Banashankari Area
In the above table, we can see that the restaurants “Devanna Dum Biryani Centre ” and “Chicken-pot Donne Biryani House” both have high similarity scores based on their intersection/common connections.
As more and more connections are added to the graph there are more features available to differentiate between restaurants. As the number of intersections between the restaurants increases the quality of recommendations also improves. It is important to understand what kind of connections are created in the graph. Adding the wrong type of relationships in the graph can lead to a decrease in the quality of recommendations.
The query below can be used to find similar restaurants given a restaurant. It computes Jaccard’s similarity between the given restaurant and all the other restaurants in the graph and then displays them.
MATCH (p1:Restaurant {name: "Alba - JW Marriott Bengaluru"})-[:SERVES_CUISINE|:SERVES_DISH|:FAMOUS_FOR|:FALL_UNDER]->(intersection)

WITH p1, collect(id(intersection)) AS p1intersection

MATCH (p2:Restaurant)-[:SERVES_CUISINE|:SERVES_DISH|:FAMOUS_FOR|:FALL_UNDER]->(intersection2) WHERE p1 <> p2

WITH p1, p1intersection, p2, collect(id(intersection2)) AS p2intersection

RETURN p1.name AS from,

       p2.name AS to,

       algo.similarity.jaccard(p1intersection, p2intersection) AS similarity

ORDER BY similarity DESC
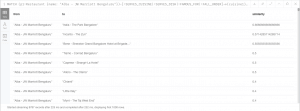
List of restaurants and their similarity to “Alba — JW Marriott Bengaluru”
Conclusion
In this blog, we learned how to leverage graphs to find similar nodes based on the relationships using Jaccard similarity.
The code is available here https://github.com/deepam8155/SimNode
